
The economic data arriving in December 2025 tells two stories so divergent they barely occupy the same country. Stock indexes surged after the Federal Reserve’s latest rate cut, with the S&P 500 and Dow posting substantial gains as traders celebrated easier monetary conditions. Corporate earnings forecasts remain optimistic. Asset valuations hold near historic highs.
Meanwhile, job openings have collapsed from their 2022 peak of 12.1 million to just 7.67 million. Layoffs are accelerating to levels not seen since early 2023. Private payroll data shows small businesses shedding 32,000 positions in November alone. And nearly 89% of Americans report feeling the squeeze from higher grocery costs, with 68% rating the overall economy as “poor.”
This is not a rounding error in the data. It is the structural signature of what economists call a K-shaped recovery—where the trajectory of wealth and well-being splits cleanly along class lines, with one branch rising and another falling. The divergence has hardened from a pandemic-era anomaly into something more permanent: a lived reality reshaping how Americans experience work, wealth, and economic security.
When Job Openings Collapse
The labor market’s deceleration is not subtle. The latest Job Openings and Labor Turnover Survey paints a portrait of demand erosion that has accelerated throughout 2025. From a peak of 12.1 million unfilled positions in March 2022—a level that reflected genuine labor scarcity and gave workers unprecedented bargaining power—openings have declined by nearly 37% to their current reading of 7.67 million.
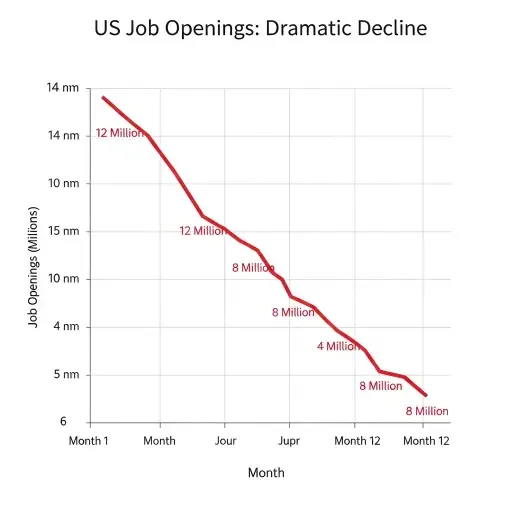
1M peak in 2022 to 7.67M in late 2025, with shaded regions marking different labor market regimes.*
This isn’t just cooling—it’s capitulation. Employers who spent 2021 and 2022 desperately competing for workers have pulled back. Layoff events, which had remained subdued even through the Fed’s aggressive tightening cycle, are now rising to their highest levels since early 2023. More telling: voluntary quits, the metric economists watch as a proxy for worker confidence and job-switching leverage, have fallen sharply. When workers stop quitting, it signals they believe opportunities are shrinking.
The ADP private payroll report compounds the picture. In November, the private sector shed 32,000 jobs—a number that understates the pain because it masks compositional shifts. Large firms with over 500 employees added positions. Small businesses, the traditional engine of American job creation and the sector where most workers are employed, cut aggressively. This is the labor market equivalent of a bifurcation: capital-rich corporations can weather uncertainty; smaller employers cannot.
For workers dependent on wage income—which is to say, the vast majority of Americans—this represents a fundamental shift in leverage. The brief window from 2021 to mid-2023, when tight labor markets forced employers to raise wages and improve conditions, has closed. Hiring freezes, selective layoffs, and cautious expansion plans now define the landscape.
The Inflation That Official Data Misses
Headline inflation has moderated. The Consumer Price Index, after peaking at over 9% in 2022, has drifted back toward the Federal Reserve’s 2% target range. Central bankers point to this as evidence that their rate hiking campaign worked. Financial markets agree, pricing in further rate cuts and a return to normalcy.
But this narrative collapses the moment you step into a grocery store or open an electricity bill. Survey data from late 2025 reveals that 89% of Americans report experiencing higher costs for food—a figure that speaks to a sustained price level shift, not transitory spikes. Holiday spending is being curtailed. Utility bills are climbing. The costs embedded in daily survival—rent, groceries, childcare, healthcare—have plateaued at elevated levels, even as goods like electronics and apparel see price declines.
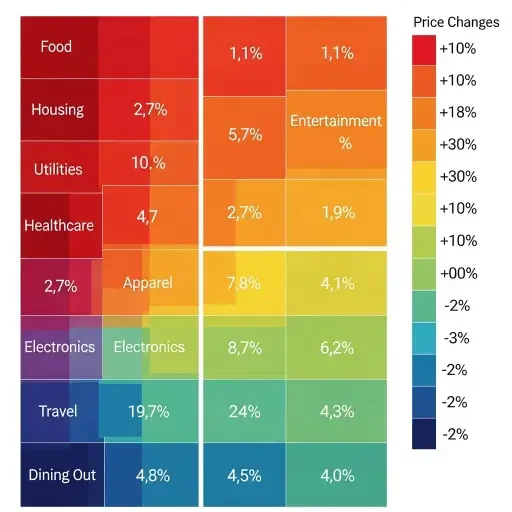
This is what economists call compositional inflation—where aggregate measures obscure the reality that price pressures concentrate in non-discretionary categories. If you’re wealthy enough to absorb a 20% increase in grocery costs without changing behavior, inflation feels abstract. If you’re living paycheck to paycheck, it’s a crisis that compounds monthly.
The divergence shows up starkly in consumer sentiment polling. Despite falling headline inflation and rising stock markets, 68% of Americans describe the economy as “poor.” Presidential economic approval ratings have cratered to historic lows, a disconnect that puzzles analysts who focus on GDP growth and unemployment rates. The explanation is simple: people judge the economy by their own financial strain, not by aggregate statistics. When your rent, food, and energy bills have risen 25-30% since 2020 and your wages have grown 15%, the macro story of “moderating inflation” feels like gaslighting.
The Federal Reserve’s Delicate Contradiction
After three consecutive rate cuts in 2025, the Federal Reserve has pushed its benchmark rate to the lowest range in three years—a policy stance designed to support demand as the labor market softens. The December rate cut, the most recent, was justified as a response to emerging slack in hiring and a desire to preemptively cushion any further deterioration.
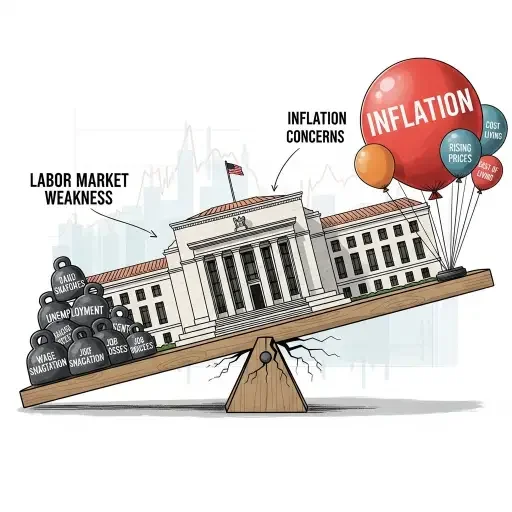
But the internal debate within the Fed reveals profound uncertainty about what comes next. Inflation in essentials persists. Core services inflation—the stickiest component, driven by wages and rents—remains elevated. Some officials worry that cutting rates too aggressively could reignite demand pressures before supply-side constraints fully resolve. Others fear that waiting too long risks pushing the economy into recession, particularly if the labor market continues to soften.
This is monetary policy threading a needle in poor visibility. The Fed is cutting rates to support an economy where unemployment remains low by historical standards (under 4%), yet job openings are collapsing and layoffs are rising. It’s easing policy while inflation in food and housing remains uncomfortably high for households. The contradiction reflects the K-shaped reality: aggregate data suggests the economy is fine, but the distribution of that performance is deeply unequal.
The bond market senses this tension. Yield curves have flattened and inverted repeatedly throughout 2025, signaling investor skepticism about the durability of growth. Credit spreads in corporate debt markets have widened for lower-rated issuers, even as investment-grade borrowers enjoy easy access to capital. The financial system itself is bifurcating—rewarding scale and balance sheet strength while punishing smaller, more levered players.
When Markets Decouple From Main Street
Equity markets have rallied through 2025 with a persistence that feels disconnected from underlying economic conditions. The S&P 500 has posted double-digit gains. Technology stocks, particularly those exposed to artificial intelligence narratives, have surged to valuations that embed extraordinary growth assumptions. The Nasdaq has recovered from earlier volatility to reach new highs.
This performance reflects several factors: rate cuts boost present values of future earnings, corporate profit margins have remained resilient despite revenue softness, and investors continue to price in productivity gains from emerging technologies. For asset holders—those with retirement accounts, brokerage positions, or equity compensation—2025 has been a wealth-building year.
But stock market performance is not a proxy for broad economic health. Roughly 10% of American households own approximately 70% of all equities. The remaining 90% have limited or zero exposure to these gains. When the S&P 500 rises 15% and your household owns no stocks, that rally might as well be happening on another planet.
The divergence between market performance and household experience is not new, but it has intensified. During the 2010s recovery, rising asset prices eventually translated into hiring and wage growth, creating at least a delayed benefit for workers. In the current cycle, that transmission mechanism appears broken. Corporate profits remain strong while hiring slows. Share buybacks and dividends return capital to shareholders while employment budgets tighten.
This is the mechanics of a K-shaped economy expressed through capital markets: those with assets accumulate wealth through appreciation and compounding returns, while those dependent on labor income face stagnant wages and diminishing opportunities.
The Lived Experience of Divergence
Economic abstractions become concrete in small, unremarkable moments. A family cancels a vacation they would have taken in 2019 because airfare and hotel costs have risen 40% while their income has grown 12%. A recent college graduate takes a job that pays less than expected because openings in their field have dried up. A small business owner delays hiring because revenue growth has stalled and borrowing costs, despite Fed cuts, remain elevated compared to the 2010s.
These individual adaptations aggregate into macroeconomic shifts. Consumer spending growth has decelerated. Savings rates among middle-income households have compressed as elevated costs eat into discretionary income. Retail sales data shows a bifurcation: luxury goods remain strong while mass-market categories struggle. Even holiday shopping, traditionally resilient, has seen consumers pulling back on non-essential purchases.

The distrust in official economic metrics has become palpable. When the Bureau of Labor Statistics reports strong job growth but your social network is full of people struggling to find work, cognitive dissonance sets in. When inflation is declared “under control” but your grocery bill has risen 30% in three years, the official narrative feels detached from reality.
This erosion of trust has consequences beyond economics. It fuels political polarization, undermines institutional credibility, and creates space for narratives—accurate or not—that speak more directly to lived experience than sanitized government data.
What a K-Shape Means for 2026
Forecasters are beginning to use phrases like “stagflation-lite” to describe the emerging environment: modest growth, persistent inflation in key categories, and a labor market that neither collapses nor fully recovers. This is not the 1970s stagflation—GDP growth remains positive, unemployment is low—but it shares the unsettling characteristic of simultaneous stagnation and price pressure.
If this pattern persists into 2026, the K-shape will deepen. Asset holders will continue accumulating wealth through market returns and property appreciation. Workers will face compressed wage growth, limited mobility, and rising costs for essentials. The gap between balance sheets will widen, not because of different work ethics or talents, but because of structural features: who owns assets, who depends on wages, and how inflation distributes its burden.
There are scenarios where this divergence narrows. A productivity boom from AI and automation could drive wage growth and reduce costs. A housing supply surge could ease rent burdens. A tighter labor market could restore worker bargaining power. But absent deliberate policy interventions—investment in childcare, housing supply, education, and progressive taxation—the default trajectory appears to be further stratification.
The Dual Economy Is No Longer Temporary
The story of 2025’s economy is not one of expansion or contraction. It is a story of parallel realities that intersect only in the data aggregates. One reality features portfolio gains, low borrowing costs for the creditworthy, and access to capital. The other features grocery sticker shock, hiring freezes, and the quiet anxiety of costs rising faster than income.
Understanding this K-shape is essential not just for interpreting economic data, but for grasping the texture of American life in 2025. The divergence is structural, not cyclical. It reflects decades of policy choices around taxation, labor regulation, housing, and monetary policy that have systematically advantaged capital over labor.

The question is no longer whether this dual economy exists—the data proves it does. The question is whether it can be sustained, and at what social cost. Markets can rally while households struggle, but only for so long before the contradictions express themselves in politics, in consumption patterns, and in the lived stability of a society.
Before the bills and after the markets—this is where most Americans actually live. And that lived experience, not the S&P 500, will ultimately define whether 2025’s economy was strong or fragile, resilient or breaking.
Tags
Related Articles
Sources
Analysis based on Federal Reserve policy statements, JOLTS labor data, ADP employment reports, consumer sentiment surveys from New York Post and Axios, market data from Financial Times and Reuters