Rivian’s R2 launches at an inflection where demand, battery economics and material supply together determine whether the market downgrades risk into growth.

The R2 is Rivian’s explicit answer to a simple investor question: can the company scale beyond premium pickup and SUV niches and capture volume at lower prices? Expansion requires hitting margins at price points where mainstream consumers buy. If Rivian misses, losses compound fast; if it hits, revenue and margin stories converge into durable optionality.
Three binding constraints set that outcome. First, end‑market elasticity: will price reductions and broader product-market fit translate into sustained demand, or merely a near-term pull-forward? Second, pack-level economics: are battery cost curves predictable and steep enough to restore gross margins? Third, supply resilience: can Rivian source nickel, cobalt alternatives, lithium hydroxide, and precursor cathode materials without margin-crushing volatility? Each is necessary; none is sufficient alone.
Investors therefore should think like allocators: which of these three levers does the market already price in, and which are latent? Today’s market prices Rivian as a high-variance bet—unit growth potential balanced against structural margin risk. That balance will shift when the R2 delivers first public, verifiable metrics: realized pack costs, warranty claims, and early order-to-delivery conversion.
The R2’s MSRP targets materially lower segments than Rivian’s earlier R1 vehicles. Adoption depends on two dynamics: feature parity perceived by mainstream buyers (range, reliability, charging access) and distribution friction (dealer networks, direct-sale regulations, service footprint). A healthy early funnel — deposits, repeat purchase intent, and regional reservation robustness — reduces uncertainty about scale. But conversion, not reservation volume, matters to cash flow and to the amortization of fixed factory costs.
Short-term signals investors can watch: conversion rate from reservation to purchase at 90–180 days; regional shift in reservation concentration (Sun Belt vs. Rust Belt); early trade-in behavior showing whether R2 draws customers from ICE models or from competitor EVs; and heterogeneity in financing approvals, which reveal effective demand elasticity.

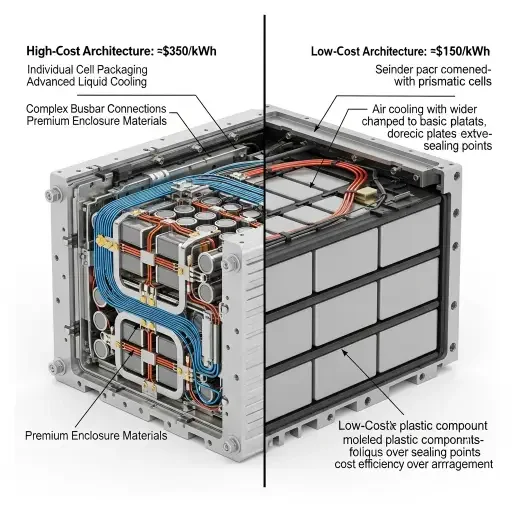
Battery cost curves are the second axis of re-pricing. Rivian’s gross margin, at scale, is a function of $/kWh at pack level, plus thermal systems and manufacturing yields. Recent industry data suggest battery pack prices have resumed modest declines as chemistries diversify and CEL (cell energy density) improvements accumulate. But the era of 15–20% year-over-year declines appears over; future gains will be incremental and engineering-driven.
For investors that means measuring realized pack $/kWh for the R2 in public filings and supplier disclosures, not Nex‑type press releases. Track Rivian’s stated cell suppliers and form factors (pouch vs. prismatic vs. cylindrical), cell-to-pack innovations (structural pack, tabless cells), and deployed cathode recipes (high‑nickel NMC vs. LMFP variants). A swing of $10–$20/kWh materially changes per-unit gross margin on mid-range models.
Supply-side proxies include long-term offtake contracts, buy-in to gigafactory joint ventures, inventory days of critical precursors, and hedging of lithium and nickel exposures. Elevated spot volatility or rolling supplier shortfalls are early warnings that margins could be transient.
The third constraint—material supply resilience—links geopolitics, capital allocation and platform power. Critical materials are concentrated: spodumene and hydroxide from a few geographies, precursor cathode processing in limited refineries, and cathode active material capacity tightly scheduled. A single bottleneck (say, a precursor plant outage) can compress available cell supply or spike prices, passing through to OEMs within quarters.
Resilience manifests in vertical integration, diversified supplier bases, and near-shoring. Rivian’s latitude to secure supply depends on its capital posture and willingness to sign long-term contracts at present prices. Investors should observe Rivian’s capital allocation disclosures: prepayments, equity stakes in suppliers, or structured tolling deals. Those moves trade balance-sheet capital for supply certainty—reducing operational variance but increasing financial leverage.
Concrete investor signals: announced multi-year offtake volumes, percentage of pack volume tied to contracted vs. spot purchases, and geographic diversification of cathode/precursor suppliers. Absent these, the company remains exposed to episodic price shocks and scarcity rent.
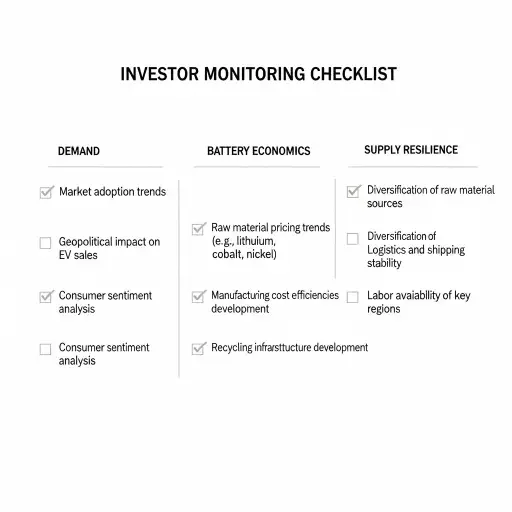
The R2’s launch is not a binary success/failure theater; it’s a sequence of measurable events that will re-price Rivian’s risk profile. The cognitive trick for investors is to transform narrative into metrics: reservation-to-conversion rates, realized $/kWh, supplier contract coverage, and early warranty or reliability flags.
Monitor conversion and pack economics first, then supplier contracts—if all three move favorably, market risk will re-price to growth; if any falter, downside remains magnified.
Tags
Related Articles
Sources
Rivian company announcements, earnings reports, and product launch materials; EV market analysis from Bloomberg, Reuters, and automotive trade publications; battery technology and supply chain research; critical materials market data.