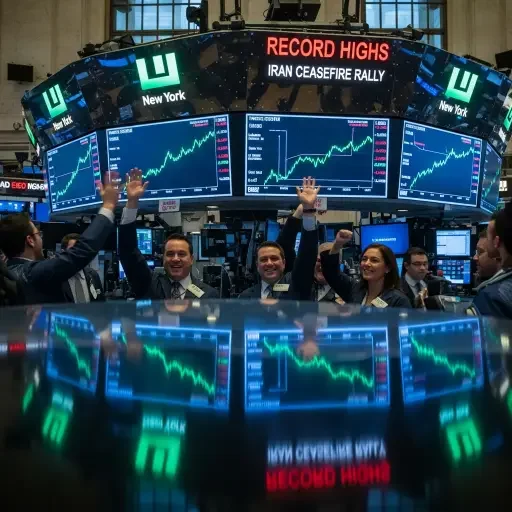
On Wednesday, April 16, the S&P 500 closed at 7,023 — an all-time high, surpassing its January record. By Friday, after Iran’s foreign minister declared the Strait of Hormuz “completely open” and oil crashed 11% to $82, the index had surged to 7,126. The Nasdaq hit records on eleven consecutive sessions. Deutsche Bank noted that the 9.8% gain over ten trading days was faster than the post-Liberation Day rally of 2025, faster than the post-Covid bounce of 2020. Ed Yardeni, among the most widely followed strategists on Wall Street, called it “yet another V-shaped buy-the-dip recovery.”
The problem is that almost nothing on the ground justifies this speed. The Strait of Hormuz, through which 20% of the world’s oil normally flows, saw only a handful of ships pass on Friday — one of them a cruise liner with no passengers aboard. Enrichment talks between U.S. and Iranian delegations collapsed in Islamabad after Vice President JD Vance said Iran refused American demands to abandon nuclear weapons development. The IMF cut its 2026 global growth forecast to 3.1% and raised its inflation projection to 4.4%. The IEA warned that Europe has roughly six weeks of jet fuel remaining. And oil, at $82, is still 20% above pre-war levels — high enough to suppress consumer spending and complicate every earnings model that assumed $65.
The market is not irrational. It is making a very specific bet. Investors have a name for it now: the TACO trade. Trump Always Chickens Out.
The Pattern That Trained the Market
The logic is not complicated, and it is not stupid. Over the past two years, investors have been conditioned by a repeating sequence: a crisis emerges, markets sell off, Trump escalates rhetorically, then reverses course when the economic pain registers. Liberation Day tariffs in April 2025 were the formative case — a sharp selloff followed by a 90-day pause that triggered one of the fastest rallies in modern market history. The Iran war has followed the same cadence. Trump threatened to destroy Iranian civilization by Tuesday night, then accepted a ceasefire by Tuesday evening. He announced a U.S. blockade of the Strait of Hormuz — the market gained another percent.
Mark Zandi of Moody’s observed that stocks have been resilient partly because investors “have been conditioned to believe that President Trump will back off if the economic pain becomes too intense.” CNBC’s reporting this week used a more direct framing: traders are treating every escalation as a buying opportunity because the pattern has rewarded that behavior every time.
But the pattern also has a structural explanation beyond psychology. The companies that dominate the S&P 500 are genuinely insulated from oil prices in the near term. Microsoft, Nvidia, Alphabet, Amazon, and Meta — the Magnificent Seven that account for nearly half the index’s market capitalization — run on electricity and engineers, not petroleum. Their forward earnings multiples remain defensible. The Magnificent Seven fund has gained nearly 18% since the S&P’s late-March low; the rest of the index is up about 8%. The headline number is a tech story wearing a macro disguise.
What Has Actually Changed
The ceasefire announced on April 7 produced two concrete developments over the following ten days — both of them arriving in the final 48 hours.
On April 16, the United States brokered a 10-day cessation of hostilities between Israel and Lebanon, the conflict that had nearly torpedoed the Iran ceasefire on its first day. The State Department framed the truce as enabling “good-faith negotiations toward a permanent security and peace agreement,” though Israel’s forces remain deployed in southern Lebanon and Hezbollah has indicated it will not disarm while they stay. Fireworks and celebratory gunfire lit up Beirut at midnight. Iran immediately linked the Lebanon truce to Hormuz.
On April 17, Iran’s Foreign Minister Abbas Araghchi posted that passage through the Strait is “completely open for all commercial vessels.” Oil plunged — WTI fell to $82.59, Brent to $90.38 — and the S&P 500 leapt 1.2% to yet another record. Trump celebrated on Truth Social. But the announcement carried fine print that the market processed only selectively. Araghchi referenced a “coordinated route” administered by Iran’s Ports and Maritime Organisation, language that suggests transit tolls or Iranian oversight of the waterway, a framework the EU’s Kaja Kallas immediately warned would “set a dangerous precedent for global maritime routes.” Shipping companies expressed caution. Iranian state media reacted skeptically to their own foreign minister’s declaration. And the actual number of ships transiting remained negligible.

The Inflation Report That Didn’t Matter
On April 10, the Bureau of Labor Statistics confirmed what everyone expected: headline CPI surged 0.9% in March, pushing the annual rate to 3.3% — a near two-year high. The gasoline index alone rose 21.2% in a single month, accounting for three-quarters of the total increase. Real wages fell 0.6%. The April print, capturing a full month of wartime energy prices, is expected to push the annual rate toward 4%.
Yet core CPI came in at 2.6%, a tick below consensus, with services inflation cooling and shelter costs flattening to their lowest gain since mid-2021. Goldman Sachs Asset Management said the Fed could “look through the energy-driven noise so long as these factors hold.” Markets barely flinched. Fed futures are pricing roughly eight basis points of cuts by year-end — effectively zero — and the next FOMC meeting on April 28 is expected to produce no action. The stagflation trap that dominated the narrative two weeks ago has been quietly shelved, replaced by a bet that oil will keep falling and core will keep behaving.
That bet depends entirely on the ceasefire holding and Hormuz reopening at scale. If neither happens, the April CPI print will not be kind to the thesis. Kiplinger’s inflation outlook projects the annual rate near 4.0% until gasoline prices begin falling in earnest — and gasoline prices cannot fall in earnest until tanker traffic normalizes, which has not yet begun.
The Four Signals That Will Break the Tie
The market’s optimism and the ground truth are currently running on parallel tracks. One of them will have to converge. An analysis from Invezz this week identified the four signals that will determine which track wins, and the framework is worth adopting.
First, Q2 earnings guidance. The oil shock did not begin until late February, meaning Q1 results — which are beating estimates — largely predate the damage. When CFOs issue forward guidance in July, any meaningful margin compression or revenue downgrades will hit fast. Oil supply shocks move through the economy with a lag of two to four quarters. Higher energy costs raise input costs for manufacturers, shipping, food production, and consumer spending. None of that has appeared yet in quarterly results.
Second, actual Strait traffic. Iran said Hormuz is open. The question is whether ships believe it. If tanker transits do not recover significantly by midsummer, the “it’s already over” narrative collapses under its own weight. Britain and France are hosting a 40-nation summit to establish an international mission for Hormuz reopening — the fact that this is considered necessary tells you what the shipping industry thinks of a social media declaration.
Third, the diplomatic pattern breaking. Trump has signaled a deal is imminent, possibly within days. He has said this before. If talks resume in Islamabad this weekend and produce a framework, the rally has room to run. If they fail again — as they did when Vance walked out over enrichment — the conditioned buy-the-dip reflex faces its first real test of faith.
Fourth, credit markets. High-yield spreads have remained surprisingly calm through the rally. If they begin widening, it means the debt markets are pricing something the equity markets are choosing to ignore. Bond markets tend to be right when they disagree with stocks.
Where This Leaves Portfolios
The honest positioning question is not whether the market is wrong — it might be exactly right. The question is what happens if it is wrong by even two weeks. A rally built on pattern recognition and mechanical flows — CTA re-entry, short covering, options-driven gamma squeezes — can reverse at the same speed it arrived. Deutsche Bank flagged that this was a “momentum-led rebound,” driven by the same systematic forces that amplified the March selloff in reverse.
The structural trades from early April still hold, but the entry points have worsened considerably. Energy names like Exxon have pulled back from their peaks but remain elevated. Gold, which J.P. Morgan still targets at $6,300 by year-end, has been rising alongside equities — a signal that not everyone trusts the rally. Measured in gold, the S&P 500 has been trending sideways to down, suggesting that some of the nominal gains are an illusion eroded by the very inflation the market claims to be looking through.
The defensive positioning that made sense on April 8 — real assets, industrials, healthcare, domestic producers — has not stopped making sense just because the index hit a record. Defense budgets across Europe and the Gulf are permanently reset. Fertilizer supply chains remain disrupted. The airlines surging on ceasefire relief are surging on a Hormuz reopening that has not yet produced a single loaded tanker transit at scale. The spread between what the market has priced and what the physical world has delivered is as wide as it has been at any point in this crisis.
Markets are forward-looking. That is their virtue and, occasionally, their vice. The S&P 500 at 7,126 is a statement of collective conviction that the war ends, the oil flows, the Fed eventually cuts, and earnings keep compounding at 13% growth. Every one of those propositions is plausible. None of them is confirmed. And the name the market has given its own thesis — Trump Always Chickens Out — is a sentence that works perfectly until the one time it doesn’t.
Tags
Related Articles
Sources
NBC News, CNBC, CNN, Bloomberg, ABC News, Al Jazeera, BLS CPI release, Dallas Fed, IMF World Economic Outlook, Deutsche Bank Research, Oxford Economics, FactSet, Schwab Sector Views, Invezz, Kiplinger, Morningstar, US State Department, UN News