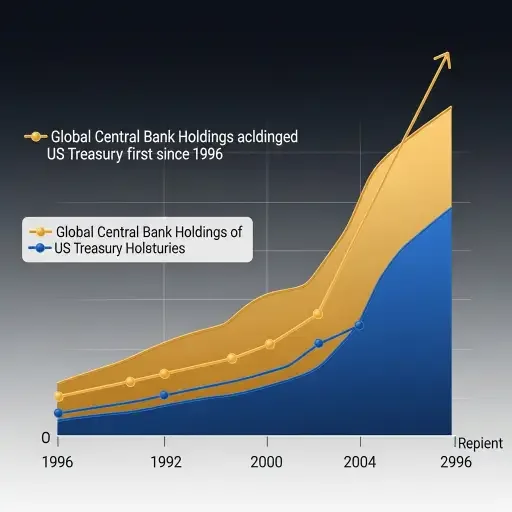
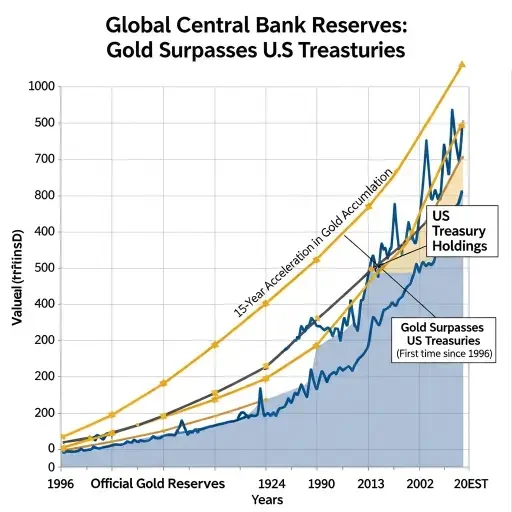
Gold now represents 24 percent of global central bank reserves, the highest share since the 1990s, while the dollar’s portion has declined to approximately 58 percent. The crossing point arrived in Q2 2025 after three consecutive years of central bank purchases exceeding 1,000 tonnes annually—more than double the 2010-2021 average of 400-500 tonnes per year.
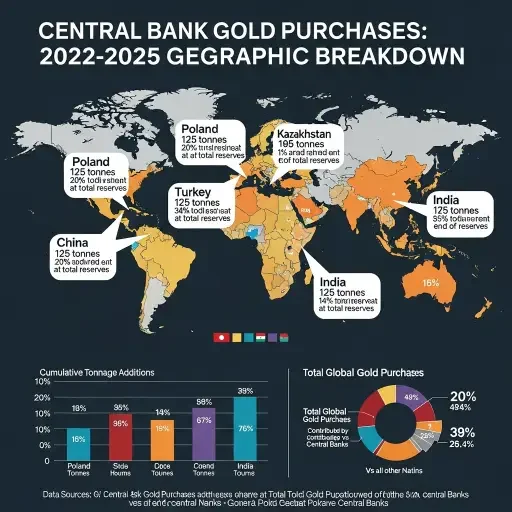
The acceleration follows Russia’s February 2022 invasion of Ukraine and the subsequent freezing of Russian foreign exchange reserves by G7 nations. That event functioned as a watershed moment for reserve managers in emerging economies, exposing the vulnerability of dollar-denominated holdings to geopolitical sanctions. China, Poland, Turkey, India, and Kazakhstan have led the accumulation, with the People’s Bank of China adding gold for 14 consecutive months through December 2025, bringing reported holdings to 2,304 tonnes.
Price-Insensitive Institutional Demand
Poland emerged as the largest buyer in 2025 with 67 tonnes in net purchases, maintaining aggressive accumulation despite gold trading above $4,000 per ounce for much of the year. National Bank of Poland Governor Adam Glapiński has characterized gold holdings as essential financial security, noting that the metal is “free from credit risk and cannot be devalued by any country’s economic policy.”
Central bank demand exhibits low price elasticity. The World Gold Council projects official sector purchases of 750-900 tonnes in 2026, below the 2022-2024 peak but still elevated relative to historical norms. At current price levels around $4,000 per ounce, central banks require fewer tonnes to reach target allocation percentages, but the purchasing pattern persists. Third-quarter 2025 saw net purchases reaccelerate to 220 tonnes after a brief moderation, indicating sustained institutional appetite.
The mechanics of reserve diversification create structural support for prices independent of Western investment flows. When a central bank targets a specific percentage allocation to gold—say, moving from 5 percent to 8 percent of total reserves—that rebalancing demand functions as a standing bid that absorbs supply regardless of short-term price movements. The combination of emerging market reserve growth and ongoing diversification creates a demand floor that has proven durable through multiple price regimes.
Jewelry Demand Destruction Emerges
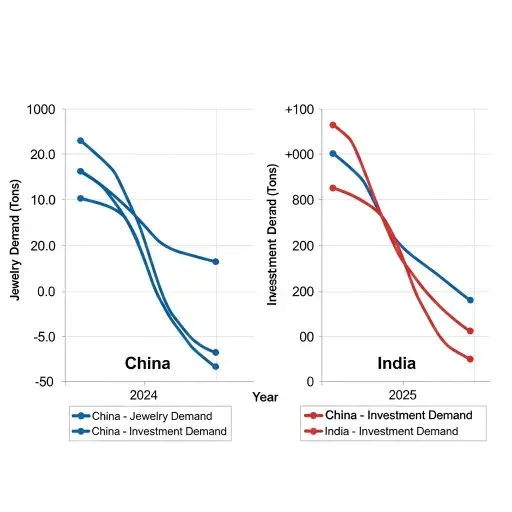
Record prices have created significant stress in consumer markets. China’s jewelry demand fell 20 percent year-over-year in Q2 2025 to just 69 tonnes, marking the fifth consecutive quarterly double-digit decline and reaching levels last seen during the initial COVID-19 outbreak in Q1 2020. India posted similar deterioration, with jewelry consumption down 17 percent to 89 tonnes as domestic prices breached the psychologically significant Rs100,000 per 10 grams threshold.
Jewelry represents approximately 40 percent of total global gold consumption, making the volume contraction material to overall demand dynamics. The World Gold Council reported that Q2 2025 global jewelry demand of 341 tonnes fell 30 percent below the five-year quarterly average of 487 tonnes, the lowest level outside pandemic disruptions. Among 31 measured markets, Iran was unique in posting year-over-year growth, driven by consumers buying jewelry as a proxy investment vehicle.
The decline concentrates in mass-market segments sensitive to affordability constraints. Indian consumers have shifted toward lighter-weight 18-karat plain gold pieces and increasingly accept gold-plated silver jewelry as a substitute. The Bureau of Indian Standards recently approved hallmarking for 9-karat jewelry, formalizing a trend toward lower gold content per piece. In China, consumers have pivoted sharply toward pure investment products, with bars and coins comprising over 60 percent of household gold demand in Q2 2025—a series record according to World Gold Council data.
Investment Flows Offset Consumer Weakness
The shift from adornment to investment has preserved aggregate demand despite jewelry weakness. Gold-backed ETFs globally recorded net inflows of 700 tonnes in 2025, the strongest annual accumulation on record. In China and India specifically, ETF holdings expanded 73 percent over the past 12 months, growing five times faster than ETFs in the rest of the world combined. Indian gold ETF inflows through October 2025 totaled INR276 billion ($3.1 billion), exceeding the cumulative total from March 2020 through December 2024.
The behavioral economics of this transition reflect gold’s dual role as consumption good and store of value. At elevated prices, the opportunity cost of wearing gold jewelry rises relative to purchasing investment bars that carry minimal fabrication premiums and preserve optionality for future sale. During festivals like Dhanteras and Diwali, Indian households maintained traditional gold-buying customs but channeled expenditure toward coins and small bars rather than ornate pieces. Mumbai dealer Ashok Jain of Chenaji Narsinghji noted that investors are “paying a premium over record prices, hoping the rally keeps going.”
Western institutional demand has also returned after several years of muted activity. North American gold ETF holdings remain well below 2020 peaks, suggesting room for normalization if the repricing of geopolitical risk persists. Money market funds in the United States hold approximately $7.5 trillion as of November 2025, creating a large potential source of reallocation if Federal Reserve easing continues and real yields compress further.
Wall Street Consensus Projects Further Upside
Major banks have revised projections upward following 2025’s performance. JPMorgan forecasts gold averaging $5,055 per ounce in Q4 2026 and identifies the metal as its “highest-conviction long” heading into the Federal Reserve’s anticipated easing cycle. The bank projects a potential long-term target of $6,000 by 2028, driven by real rate compression and continued global diversification away from dollar assets.
Goldman Sachs targets $4,900 by the final quarter of 2026, while Bank of America projects prices reaching $5,000 during the year with an average closer to $4,400. Morgan Stanley recently increased its 2026 forecast to $4,400 from a prior estimate of $3,313, citing a weaker dollar, sustained ETF inflows, and robust central bank accumulation. UBS set a mid-2026 target of $4,500 with an upside case approaching $4,900.
The range of institutional forecasts clusters between $4,400 and $5,500, with consensus building around the view that the 2025 rally represents an early phase of a multi-year repricing rather than a cyclical peak. State Street’s analysis suggests that even at reduced tonnage levels, central bank buying in 2026 would mark the 17th consecutive year of net official sector purchases—a pattern unprecedented since the collapse of the Bretton Woods system in 1971.
Bear Case: Reflation and Demand Destruction
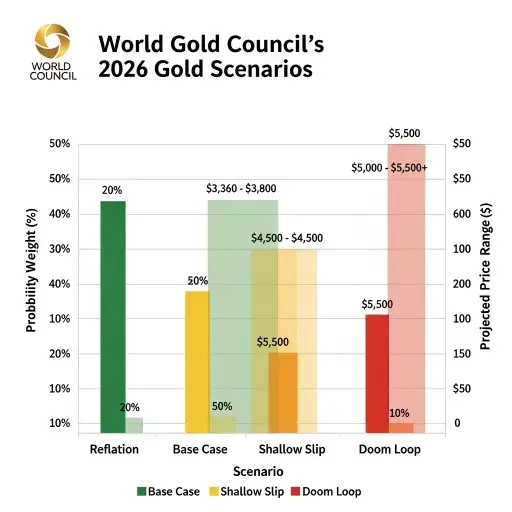
The World Gold Council’s scenario analysis identifies meaningful downside risks. In the “Reflation Return” scenario—assigned roughly 20 percent probability—successful implementation of fiscal stimulus under the Trump administration drives genuine economic acceleration and rising inflation. The Federal Reserve would respond by holding rates steady or potentially hiking, pushing real yields higher and strengthening the dollar materially. Under these conditions, gold could retrace 15-20 percent to the $3,360-3,800 range.
Technical analysts note that a decline to the $3,300-3,440 zone would test previous resistance-turned-support levels from April-August 2025, where the 200-day exponential moving average would likely intersect price. This would constitute a retest of prior highs rather than a breakdown of the multi-year bull trend structure. As long as the pattern of higher lows and higher highs remains intact, such a correction would function as a buying opportunity rather than a reversal signal.
The jewelry demand destruction already underway could accelerate if prices push materially above $4,500. At some threshold, discretionary purchases in India and China simply cease, and even needs-based festival and wedding buying contracts to minimal levels. This price-volume relationship creates a natural governor on speculative excess, though investment demand has so far absorbed the consumption weakness.
A more severe scenario would require a return to the conditions that triggered gold’s multi-decade bear market following its 1980 peak. Federal Reserve Chairman Paul Volcker’s decision to raise interest rates to 20 percent crushed inflation but sent gold from $850 per ounce to below $300 by the late 1990s. A modern equivalent would demand policy commitment to sustained real yields above 4-5 percent regardless of economic pain—a politically implausible outcome given current US debt levels approaching $36 trillion and ongoing fiscal deficits.
Geopolitical Architecture Supports Duration
The structural case for elevated gold prices rests on forces that exhibit low reversibility over policy-relevant time horizons. The freezing of Russian reserves demonstrated that dollar-denominated holdings carry counterparty risk in the form of sanctions exposure. For reserve managers in Beijing, New Delhi, Ankara, and Warsaw, this represents a permanent update to the risk model that cannot be unlearned even if immediate geopolitical tensions moderate.
China’s September 2025 announcement that it would serve as custodian for foreign sovereign gold reserves creates network effects around non-dollar settlement systems. As more emerging market central banks store gold in Shanghai rather than London or New York, the infrastructure for an alternative reserve architecture gains density. This does not imply near-term displacement of the dollar as the dominant global currency, but it reduces the marginal utility of holding incremental Treasury securities when gold provides comparable liquidity without sanctions vulnerability.
The pace of de-dollarization remains slow and non-linear. The dollar’s share of global reserves has declined from approximately 72 percent in 2001 to 58 percent currently—a 20-year trend that has accelerated modestly but not dramatically since 2022. Gold’s rise represents diversification at the margin rather than wholesale abandonment of dollar-based systems. However, the direction of travel is clear, and the combination of sustained central bank demand plus Western institutional participation creates a bid profile that supports prices well above historical norms.
Energy infrastructure constraints and fiscal sustainability questions in the United States add longer-duration support. As AI data center buildouts strain electrical grids and drive up power costs, the economic cost of maintaining dollar hegemony through military and financial infrastructure becomes more visible. Federal deficits exceeding $2 trillion annually create ongoing concern about long-term debt sustainability, making hard assets like gold attractive as hedges against eventual monetization pressure.
The intersection of these forces—sanctions risk, infrastructure constraints, fiscal concerns, and geopolitical fragmentation—creates a macro regime in which gold functions as a neutral reserve asset without counterparty exposure. Central banks are treating the 2025 rally not as a cyclical peak to fade, but as a repricing of gold’s structural role in a multipolar monetary system. Whether prices consolidate around $4,000-4,500 or push toward $5,000+ in 2026 depends on the pace of Federal Reserve easing and the trajectory of geopolitical risk, but the underlying demand architecture has shifted decisively.
Related Articles
Sources
Research drawn from World Gold Council Gold Demand Trends Q2 2025 and Gold Outlook 2026 reports, JPMorgan Global Research commodities outlook and gold price forecasts, Goldman Sachs, Bank of America, Morgan Stanley, UBS precious metals research, National Bank of Poland official statements on reserve strategy, People's Bank of China official reserve data through December 2025, India gold ETF flow data from Association of Mutual Funds in India (AMFI), World Bank Commodity Markets Outlook October 2025, Federal Reserve IFS data on central bank reserve composition, and Bloomberg commodity price data and CME gold futures curves.