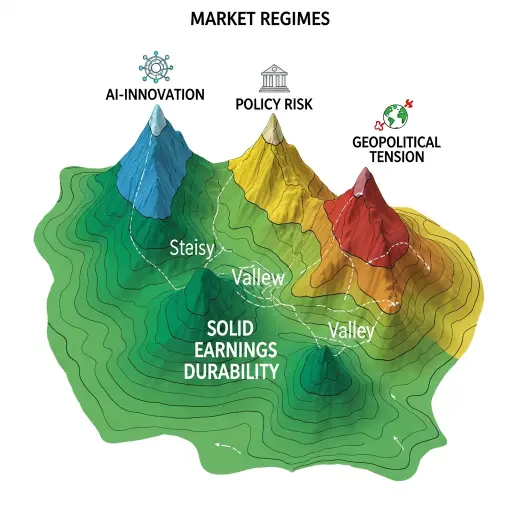
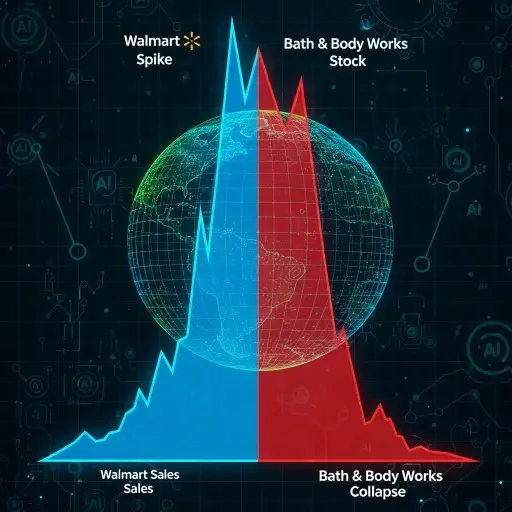
We stand at an inflection point where three mathematical attractors contend for dominance: the exponential acceleration of AI capabilities pushing toward a singularity-adjacent moment in capital allocation; the linear deceleration of traditional economic indicators suggesting mean reversion after extraordinary monetary expansion; and the oscillating geopolitical tensions weaving strange-loops between cooperation and confrontation. The data sketches a Phase 3 market condition where correlation matrices fracture, and the world’s equity colors bleed into disparate palettes. Walmart up 6% while Bath & Body Works dives 23%—retail, consumer-facing, sharing a sector, yet inhabiting entirely different probability worlds. It is a bifurcation that echoes quantum superposition: assets exist simultaneously in “AI-blessed” and “AI-irrelevant” states until observed by capital flows.
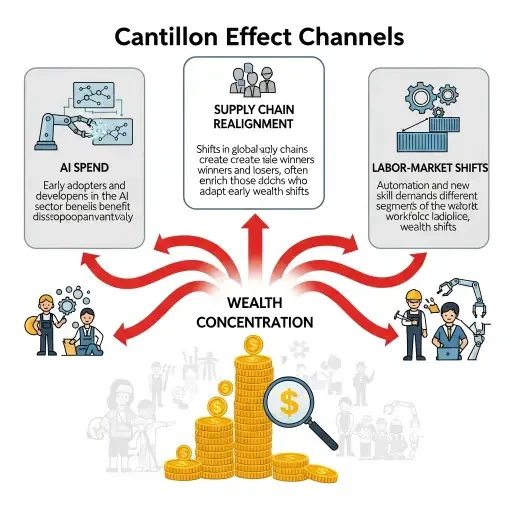
The UK’s fiscal deterioration—an overshoot of £17.4 billion—meets Japan’s stimulus pulse and China’s assertive geopolitical posture. These are not discrete stories but lines in a single ledger, the unwinding of the post-2008 central bank consensus. Nvidia’s 62% revenue surge sits atop softer consumer sentiment, a Cantillon Effect amplified to the volume of an entire sector. The money printer’s proximity to AI innovation concentrates gains at the core, while the periphery bears the tax of delayed productivity. In metaphor and arithmetic, we’re witnessing a Lyapunov instability: tiny perturbations—tariffs, regulatory tweaks, energy constraints—could push the system into a non-linear phase transition, where yesterday’s equilibria vanish and new attractors emerge.

Consider the mergers and bids shaping the horizon: Exact Sciences acquired for $21 billion; Warner Bros Discovery in play as capital sinks toward “too big to fail” behemoths. These moves compress degrees of freedom in the system, tightening the feedback loops that long rewarded dispersion and structural agility. The moves are not simply strategic; they are architectural, altering the topology of risk and opportunity. When capital consolidates, the distributional tails widen for some assets and compress for others, reshaping the practical calculus of risk parity and timeline-arbitrage.
Within this frame, three questions anchor the analysis: Where do correlations hold, and where do they break? Which firms benefit most from AI-driven capex surges, and which suffer from macro-drag? How do policy and geopolitics rearrange the connective tissue between innovation and demand?
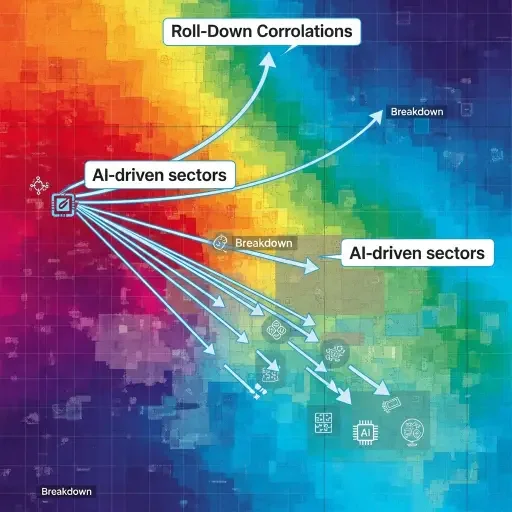
First, correlations are not collapsing uniformly; they are transforming. The AI-enabled productivity surge creates idiosyncratic winners—semis, data infrastructure, platform enablers—while traditional cyclical drivers drift toward a different tempo. The market’s “phase space” has expanded: more states exist, more regimes are possible, and price discovery has to work harder to reveal which state holds. Investors increasingly price in a world where beta becomes a moving target and alpha a function of network effects rather than linear earnings streams.
Second, Cantillon effects intensify. Capital gravitates to the districts of AI wealth: Nvidia, hyperscalers, and the ecosystem that monetizes AI deployment. The hinterlands—the non-AI consumer, the labor-intensive subsectors, the long-tail detractors—absorb the rebound effects of policy and energy costs with increasing severity. This is not merely distributional inequality; it is a reengineering of cash flows, where the timing and location of money determine who learns fastest, who fails slower, and who exits politely.
The third thread is structural, not episodic. The episodes—M&A, policy pivots, geopolitical flashpoints—signal a deeper narrative: the post-crisis consensus is loosening its grip, not collapsing into chaos but reconstituting around new center of gravity. The scary part is not the acceleration of AI in itself but the velocity mismatch: a world where AI-driven investment can outrun consumer confidence and real-economy receipts. The Lyapunov-flavored risk is a reminder that stability is a moving target, and the system’s resilience rests on the openness of liquidity channels, the flexibility of capital, and the humility of policymakers.
To navigate, we need a practical frame: the market is now a living topology. Watch the shape of the curve, not just its height. Study cross-asset relationships for signs of regime drift—where correlations become conditional on macro surprises. Track consolidation’s velocity—who gains, who loses, and how quickly. And cultivate a narrative discipline: treat every earnings beat or miss as data point in a larger geometry, not as a single datum to be hedged or chased.

The takeaways are not exotic; they are disciplined. Acknowledge the Phase 3 reality: a market where traditional levers still matter but with altered leverage. Invest with a bias toward scalable AI-enabled platforms, while hedging the exposure of consumer-facing staples to policy and sentiment shocks. Favor entities that can absorb shocks through balance sheet liquidity and diversifying cash flows. And stay alert to the structural shifts—the consolidation wave, the reweighted risk premia, and the evolving role of central banks as risk shapers rather than mere lenders.
In the end, the story is about perception under pressure. The data don’t just show a path; they sketch the architecture of possible paths. The arc of capital, now entangled with AI’s ascent and geopolitical unpredictability, is a living system. The responsible observer will read not only the headlines but the way the headlines re-sculpt the terrain beneath: where correlations bend, where wealth concentrates, where policy experiments rewrite the rules of the game.

Tags
Related Articles
Sources
Macro data from central banks; earnings and guidance from Nvidia, Walmart, Bath & Body Works; M&A activity (Exact Sciences, Warner Bros Discovery); cross-asset correlations; geopolitical risk proxies.